Visualizing the Void: Unveiling Missing Data with Python's missingno
#python #missingno #missingdata #dataanalysis
Recently while setting up Python on a new device, I instinctively installed the missingno library, along with essentials like pandas and numpy. This made me reflect on why this underrated library has become as indispensable to me as these Python staples. Let's dive into how this little-known library became a favorite of mine, and perhaps might become yours too!
Introduction
Handling missing data is a common yet critical challenge in data analysis. The missingno library in Python offers a visually intuitive way to understand the distribution and patterns of missing data. In this article, we'll explore how to use missingno to analyze missing data effectively.
Installation
First, install missingno using pip:
pip install missingnoImporting Libraries
Let's start by importing the necessary libraries:
import pandas as pd
import numpy as np
import missingno as msno
Loading a Dataset
# Sample dataframe (fetch it from github, or read your own)

path = "https://raw.githubusercontent.com/Akshaysehgal2005/Datasets/main/titanic_extended.csv"
df = pd.read_csv(path)

print(df.shape) #(1310, 14)
df.head()
Visualizing Missing Data
The missingno library offers various visualization tools to analyze missing data. Let's explore some of them -
1. Matrix
The matrix provides a heatmap-like representation of the data's completeness:
msno.matrix(df)In this matrix, the white lines represent missing values. This visualization helps in spotting trends in the occurrence of missing values.
The vertical line graph on the far right indicates the count of data points in each row, also marking the minimum and maximum counts. For instance, the number 13 signifies a row with a maximum of 13 data points at that position, while a 0 indicates a row at that position with no data points, representing an empty row.
2. Bar Chart
The bar chart shows the completeness of the dataset:
msno.bar(df)This visualization is quite practical, offering a straightforward count of missing values by column.
3. Heatmap
The heatmap shows the correlation of missingness between different columns:
msno.heatmap(df)A positive value indicates a positive correlation between the missingness of two columns, and vice versa. This concept is called Nullity Correlation.
Nullity correlation is a measure that assesses the relationship between the presence of missing values in different variables or columns in a dataset. It is a specific type of correlation that focuses on the patterns of missing (null) data rather than the actual data values.
Similar to a standard correlation coefficient, nullity correlation values typically range from -1 to 1.
A value close to +1 indicates that if one column has missing data, the other column is likely to have missing data as well.
A value close to -1 suggests that if one column has missing data, the other column is likely not to have missing data.
A value around 0 indicates no particular correlation between the missingness of the two columns.
Here, we observe an inverse nullity correlation of 0.2 between the variables Body and Boat, indicating that rows with one variable occasionally lack data in the other, and vice versa.
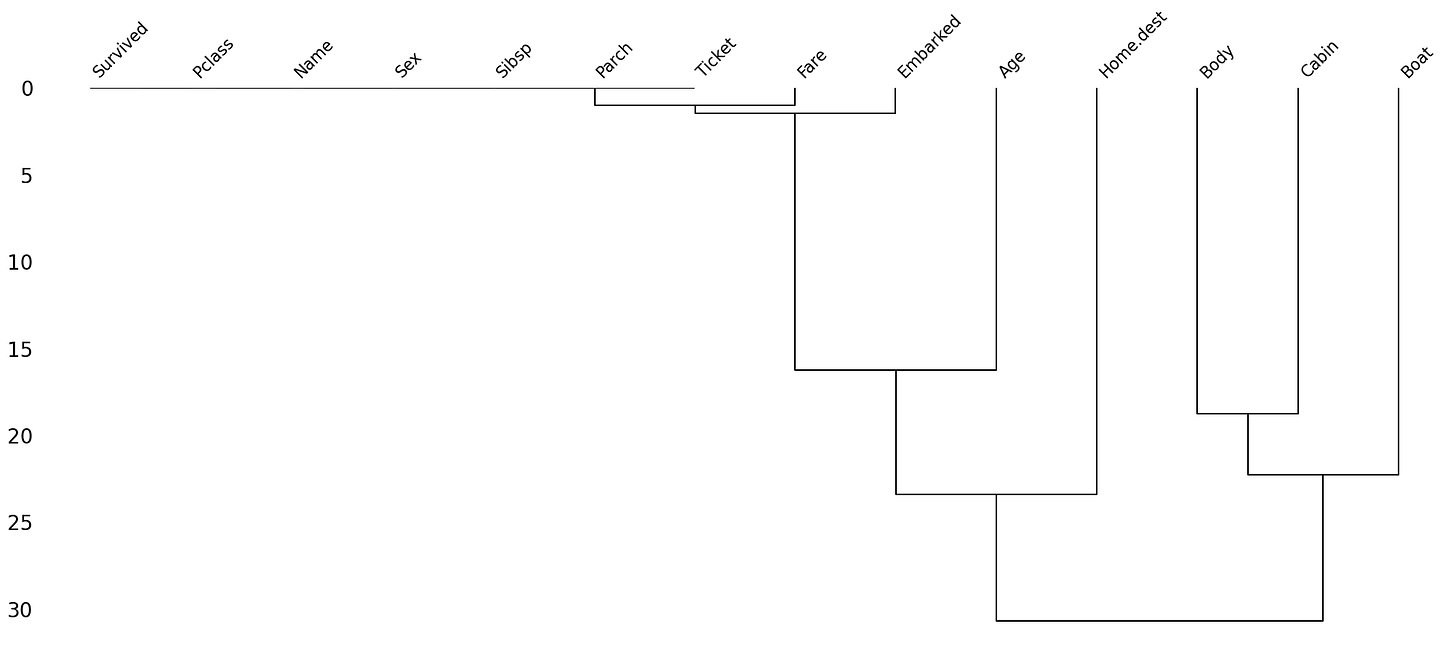
4. Dendrogram
The dendrogram helps to understand the clustering of missing data:
Columns clustered together have a similar pattern of missing data.
What’s next?
Once you have analyzed the gaps in your dataset, you could use a ton of methods for handling the missing data.
Flat remove rows with any missing data
Remove rows for specific variables containing missing data
Drop variables with high volumes of missing data
Impute missing data for numeric variables
Direct replacements using aggregates like mean, median, mode, etc.
Estimate and fill in missing data using ML (e.g. nearest neighbor imputation)
etc.
The possibilities are endless and each dataset and use-case will require its own strategy to handle information loss due to missing data. Once your dataset is cleaned up, you might want to use missingno to visualize it again which might look something like this.
Nothing is more satisfying after an hour of data cleaning than the visualization above!
Conclusion
In conclusion, missingno is a powerful tool for a preliminary check of missing data in your dataset. It helps in understanding the pattern and extent of missingness, which is crucial for any data preprocessing steps. By integrating missingno it into your data analysis workflow, you can make more informed decisions about how to handle missing values in your dataset.
Thanks to Aleksey Bilogur for authoring and maintaining
missingnofor all these years!
References
https://github.com/ResidentMario/missingno
https://www.kaggle.com/code/akshaysehgal/handling-missing-data-like-a-boss
https://scikit-learn.org/stable/modules/impute.html


